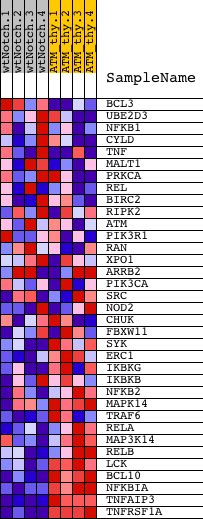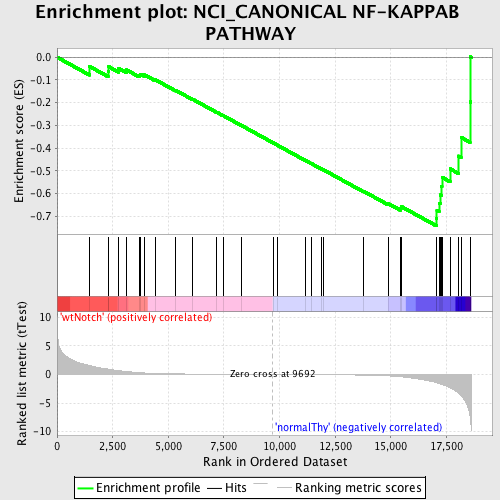
Profile of the Running ES Score & Positions of GeneSet Members on the Rank Ordered List
| Dataset | Set_03_wtNotch_versus_normalThy.phenotype_wtNotch_versus_normalThy.cls #wtNotch_versus_normalThy.phenotype_wtNotch_versus_normalThy.cls #wtNotch_versus_normalThy_repos |
| Phenotype | phenotype_wtNotch_versus_normalThy.cls#wtNotch_versus_normalThy_repos |
| Upregulated in class | normalThy |
| GeneSet | NCI_CANONICAL NF-KAPPAB PATHWAY |
| Enrichment Score (ES) | -0.74220407 |
| Normalized Enrichment Score (NES) | -1.602671 |
| Nominal p-value | 0.0054945056 |
| FDR q-value | 0.10389905 |
| FWER p-Value | 0.732 |
| PROBE | DESCRIPTION (from dataset) | GENE SYMBOL | GENE_TITLE | RANK IN GENE LIST | RANK METRIC SCORE | RUNNING ES | CORE ENRICHMENT | |
|---|---|---|---|---|---|---|---|---|
| 1 | BCL3 | 3990440 | 1455 | 1.580 | -0.0404 | No | ||
| 2 | UBE2D3 | 3190452 | 2294 | 0.950 | -0.0627 | No | ||
| 3 | NFKB1 | 5420358 | 2322 | 0.926 | -0.0419 | No | ||
| 4 | CYLD | 6590079 | 2761 | 0.674 | -0.0493 | No | ||
| 5 | TNF | 6650603 | 3118 | 0.530 | -0.0557 | No | ||
| 6 | MALT1 | 4670292 | 3693 | 0.324 | -0.0788 | No | ||
| 7 | PRKCA | 6400551 | 3738 | 0.311 | -0.0737 | No | ||
| 8 | REL | 360707 | 3934 | 0.268 | -0.0778 | No | ||
| 9 | BIRC2 | 2940435 4730020 | 4414 | 0.189 | -0.0990 | No | ||
| 10 | RIPK2 | 5050072 6290632 | 5335 | 0.111 | -0.1458 | No | ||
| 11 | ATM | 3610110 4050524 | 6074 | 0.076 | -0.1837 | No | ||
| 12 | PIK3R1 | 4730671 | 7165 | 0.043 | -0.2414 | No | ||
| 13 | RAN | 2260446 4590647 | 7457 | 0.038 | -0.2561 | No | ||
| 14 | XPO1 | 540707 | 8282 | 0.022 | -0.2999 | No | ||
| 15 | ARRB2 | 2060441 | 9730 | -0.001 | -0.3778 | No | ||
| 16 | PIK3CA | 6220129 | 9883 | -0.003 | -0.3859 | No | ||
| 17 | SRC | 580132 | 11142 | -0.022 | -0.4531 | No | ||
| 18 | NOD2 | 2510050 | 11446 | -0.027 | -0.4687 | No | ||
| 19 | CHUK | 7050736 | 11886 | -0.036 | -0.4915 | No | ||
| 20 | FBXW11 | 6450632 | 11951 | -0.037 | -0.4940 | No | ||
| 21 | SYK | 6940133 | 13785 | -0.106 | -0.5901 | No | ||
| 22 | ERC1 | 1580170 2630717 6110762 6840280 | 14877 | -0.230 | -0.6433 | No | ||
| 23 | IKBKG | 3450092 3840377 6590592 | 15419 | -0.375 | -0.6634 | No | ||
| 24 | IKBKB | 6840072 | 15462 | -0.391 | -0.6563 | No | ||
| 25 | NFKB2 | 2320670 | 17059 | -1.421 | -0.7081 | Yes | ||
| 26 | MAPK14 | 5290731 | 17073 | -1.446 | -0.6741 | Yes | ||
| 27 | TRAF6 | 4810292 6200132 | 17171 | -1.553 | -0.6420 | Yes | ||
| 28 | RELA | 3830075 | 17220 | -1.623 | -0.6056 | Yes | ||
| 29 | MAP3K14 | 5890435 | 17267 | -1.682 | -0.5677 | Yes | ||
| 30 | RELB | 1400048 | 17302 | -1.724 | -0.5282 | Yes | ||
| 31 | LCK | 3360142 | 17665 | -2.357 | -0.4910 | Yes | ||
| 32 | BCL10 | 2360397 | 18036 | -3.190 | -0.4344 | Yes | ||
| 33 | NFKBIA | 1570152 | 18160 | -3.680 | -0.3526 | Yes | ||
| 34 | TNFAIP3 | 2900142 | 18562 | -7.402 | -0.1965 | Yes | ||
| 35 | TNFRSF1A | 1090390 6520735 | 18584 | -8.303 | 0.0017 | Yes |